In the modern digital world, organizations generate massive amounts of data every day—from website traffic and online purchases to customer behavior and social media interactions. The challenge is not collecting the data but understanding what it means and how to use it effectively. This is where analytics becomes essential.
Analytics helps businesses and individuals transform raw data into valuable insights that support smarter decision-making. Companies across industries rely on analytics to optimize marketing campaigns, improve products, understand customers, and predict future trends.
Table of Contents
What Is Analytics?
Analytics refers to the process of collecting, organizing, analyzing, and interpreting data to discover patterns, trends, and insights that guide decision-making.
In simple terms, analytics answers questions like:
- What happened in the past?
- Why did it happen?
- What might happen next?
- What should we do about it?
For example, businesses use platforms like Google Analytics to track website traffic, understand user behavior, and measure marketing performance.
| Component | What It Means | Example |
| Data Collection | Gathering raw data from different sources | Website visits, sales transactions |
| Data Processing | Cleaning and organizing the data | Removing duplicates |
| Data Analysis | Identifying patterns or correlations | Which product sells the most |
| Data Visualization | Presenting insights in charts or dashboards | Reports in Tableau |
| Decision Making | Using insights to guide actions | Adjusting marketing strategy |
Why Analytics Is Important
Data alone does not provide value unless it is analyzed and interpreted. Analytics helps organizations transform raw data into meaningful knowledge that supports better decision-making. According to SAP, analytics involves examining data to uncover patterns, trends, and insights that organizations can use to improve performance and guide strategic actions.
Here are some of the key benefits of analytics:
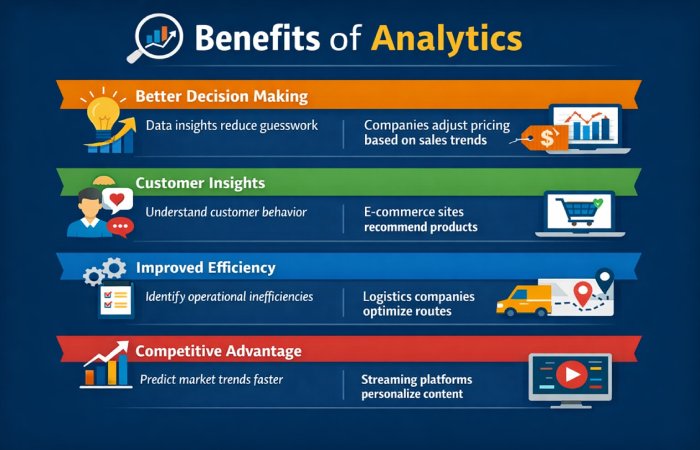
Large technology companies such as Amazon and Netflix rely heavily on analytics to improve recommendations and customer experience.
How Analytics Works
Analytics typically follows a structured process that converts raw data into actionable insights.
| Step | Description |
| Data Collection | Gathering information from sources like websites, apps, databases, and sensors |
| Data Cleaning | Removing errors, duplicates, and incomplete records |
| Data Processing | Organizing data for analysis |
| Data Analysis | Applying statistical methods to identify trends |
| Data Visualization | Presenting results through charts, dashboards, and reports |
Tools like Microsoft Power BI and Tableau help organizations visualize data insights effectively.
Popular Analytics Tools and Their Prices
Organizations use different analytics tools depending on their needs and budget.
| Tool | Best For | Free Plan | Starting Price | Key Features |
| Google Analytics | Website analytics | Yes | Free | Traffic tracking and behavior insights |
| Microsoft Power BI | Business dashboards | Limited | $10/user/month | Interactive reports |
| Tableau | Data visualization | No | ~$70/user/month | Advanced dashboards |
| Mixpanel | Product analytics | Yes | $25/month | User behavior tracking |
| Hotjar | UX analytics | Yes | $32/month | Heatmaps and session recordings |
These tools help businesses analyze data from websites, mobile apps, marketing campaigns, and internal operations.
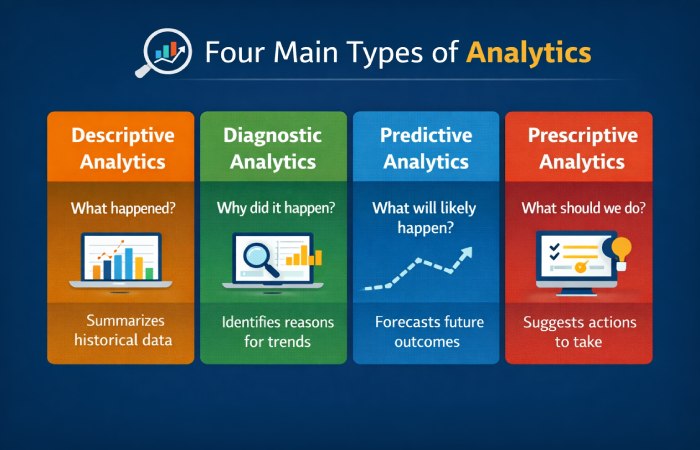
The Four Main Types of Analytics
Analytics is commonly categorized into four major types depending on the questions it answers.
| Type of Analytics | Main Question It Answers | Description | Example Use Case |
| Descriptive Analytics | What happened? | Summarizes historical data to understand trends | Website traffic reports |
| Diagnostic Analytics | Why did it happen? | Investigates causes behind patterns | Finding why sales dropped |
| Predictive Analytics | What will happen next? | Uses statistical models to forecast outcomes | Demand forecasting |
| Prescriptive Analytics | What should we do? | Recommends actions based on predictions | Pricing optimization |
Organizations typically move through these stages as they mature in their use of data.
Types of Analytics by Industry
Analytics is applied differently across sectors.
| Industry | Analytics Application |
| Marketing | Campaign performance analysis |
| Finance | Fraud detection |
| Healthcare | Patient outcome predictions |
| Retail | Demand forecasting |
| Sports | Player performance metrics |
Even government agencies and non-profits now rely heavily on data analytics.
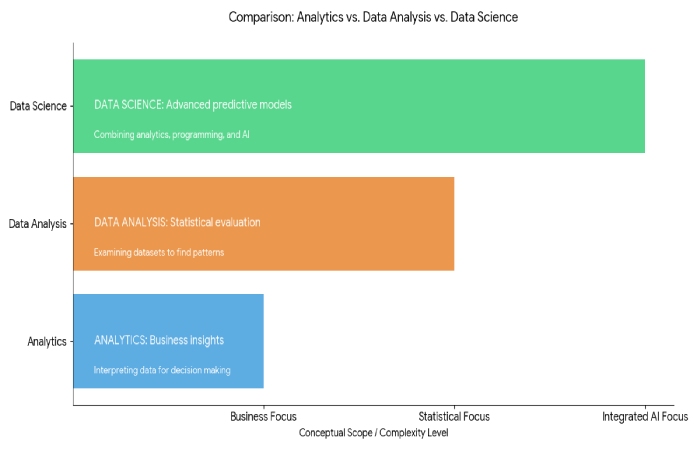
Analytics vs Data Analysis vs Data Science
Many people confuse these related terms.
| Term | Definition | Focus |
| Analytics | Interpreting data for decision making | Business insights |
| Data Analysis | Examining datasets to find patterns | Statistical evaluation |
| Data Science | Combining analytics, programming, and AI | Advanced predictive models |
Analytics often acts as a bridge between raw data and business strategy.
Real-World Examples of Analytics
Analytics influences many aspects of daily digital experiences.
E-commerce: Online retailers such as Amazon analyze browsing and purchase data to recommend products.
Streaming Platforms: Platforms like Netflix analyze viewing behavior to personalize content recommendations.
Marketing: Companies track campaign performance using tools like Google Analytics to measure traffic, conversions, and user engagement.
Skills Required for Analytics
Professionals working in analytics need a mix of technical and business skills.
| Skill | Why It Matters |
| Statistics | Understanding patterns in data |
| Data Visualization | Communicating insights clearly |
| Programming | Handling large datasets |
| Business Knowledge | Applying insights to real problems |
| Critical Thinking | Identifying meaningful patterns |
Learning platforms and tools such as Python, spreadsheets, and BI software can help beginners develop these skills.
Challenges in Analytics
Despite its benefits, analytics also comes with challenges.
| Challenge | Description |
| Data Quality | Inaccurate data can lead to wrong conclusions |
| Privacy Concerns | Handling sensitive user information responsibly |
| Skill Gap | Demand for analytics professionals is high |
| Data Overload | Too much data without clear insights |
Organizations must implement proper data governance and privacy policies to address these issues.
The Future of Analytics
Analytics continues to evolve with emerging technologies such as artificial intelligence, machine learning, and cloud computing.
Future trends include:
- Real-time analytics
- AI-driven insights
- Automated dashboards
- Self-service analytics tools
- Predictive decision systems
Technology companies like Microsoft and IBM are investing heavily in advanced analytics platforms that allow businesses to analyze large datasets quickly.
Final Thoughts
Analytics has become one of the most important capabilities in the modern data-driven economy. By transforming raw information into actionable insights, analytics helps organizations make smarter decisions, improve customer experiences, and gain a competitive advantage.
From tracking website performance with Google Analytics to building interactive dashboards with Microsoft Power BI or Tableau, analytics tools empower businesses to turn data into meaningful strategies.
As data continues to grow exponentially, the ability to analyze and interpret it will remain one of the most valuable skills in business, technology, and research.